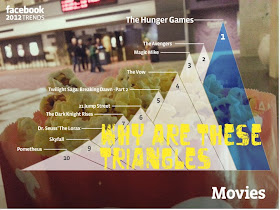
 Have you checked out your Facebook "Year in Review 2012" yet? If you're a blogger, you're probably a pro at reflection, so maybe you did. What you may have skipped (because I very nearly did) were the "Facebook Trends."
What delightfully surprised me about the 2012 Trends was that it was a collection of culturally relevant infographics. (and even broken down by country. and analyzed.)
Background
I LOVE infographics. They're really just a 21st century repackaging of pie charts, line graphs, or histograms with words and associated images, but I love them because (good) ones are designed (instead of produced) and they're relevant. Pie charts live in boring budget proposals; line graphs on the ticker of Bloomberg TV or the Wall Street Journal. But infographics get shared on your Facebook timeline. Their pinned to your "Isn't That Clever" Pinterest board. They're so integral to the layout of USA Today, you probably didn't even notice.To start off the year in AP Stats (and to ensure my students had appropriate degrees of tech proficiency before I unleashed wicked expectations upon them), I had everyone bring in infographics to share and then we discussed the ways graphs were represented and repackaged on them.
I think most of them just ended up doing a Google image search for "infographics," but here were the sites I suggested they try:
nerdgraphs.com
visual.ly
coolinfographics.com
Infographics - GOOD
flowingdata.com
The unintentional consequence of this assignment was that I also got to know my students' interest a little better through their infographic choices.
Here was my favorite; the controller pie charts opened up a discussion for me. Lost scaling opportunity in the bottom left corner about best-selling genres.
So What?
My Stats students did a good job grabbing infographics, and most of them took a clear interest to the assignment and made it meaningful, but what I like about Facebook Stories' Trends is that they're simply produced, yet relevant to their audience, and in an marketplace your students are frequenting. Better than that, in the endless battle between what I want and what I can accomplish, these graphs represent to me an even more approachable example to have my students creating their own infographs. (When that finally happens.)The one at right features songs that came up most in status updates. It's a pie chart.... but not really. Way to psych me out. I like these the slices were scaled by radial length rather than degrees because my eye tends to ignore tiny slices that have arrows pointed to them. (No offense, east coast, but this is kind of what I do when I look at maps of the US, too)
| I mean, seriously. Can't you imagine this on a .PPT slide with the speaker saying, "As you can clearly see..." |
Bottom Line:
In my opinion, infographics are one of the least intimidating ways for students to begin publishing for the web and sharing on social media. Kids love poster projects - infographics are a digital extension of that (but they don't even HAVE to be digital).
Infographics can introduce percentage problems, experimental design, discussions on statistical bias, geometric similarity, and even log scales in upper-level courses. Because they're all over the web and literally relevant to any interest, they're also convenient for enhancing engagement through choice and personalization.
Resources:
I went to a great infographic breakout session with +Kathy Schrock (@kathyschrock on twitter) at METC 2012. She's said it better than I can; here's her infographics page. If you're going to METC 2013 (after you see me) make sure you check out at least one of her sessions.


Chuck, great page and thanks for the pat on the back. I won't be at METC 2013, however, so you will have carry the "infographics" ball!
ReplyDeleteAww, too bad! I'm sure you're very busy. :)
ReplyDelete